


ISPS HANDA 欧州・日本どっちが勝つかトーナメント! 2024

- ツアー
ISPS HANDA 欧州・日本どっちが勝つかトーナメント!
Round18:50 濃霧による視界不良の為、スタート時刻を2時間50分遅延(6:20→9:10 11:20→14:10)
ISPS HANDA 欧州・日本どっちが勝つかトーナメント! 2024
初日は2時間50分遅れでスタート。今季初シードの前田光史朗が滑り込み
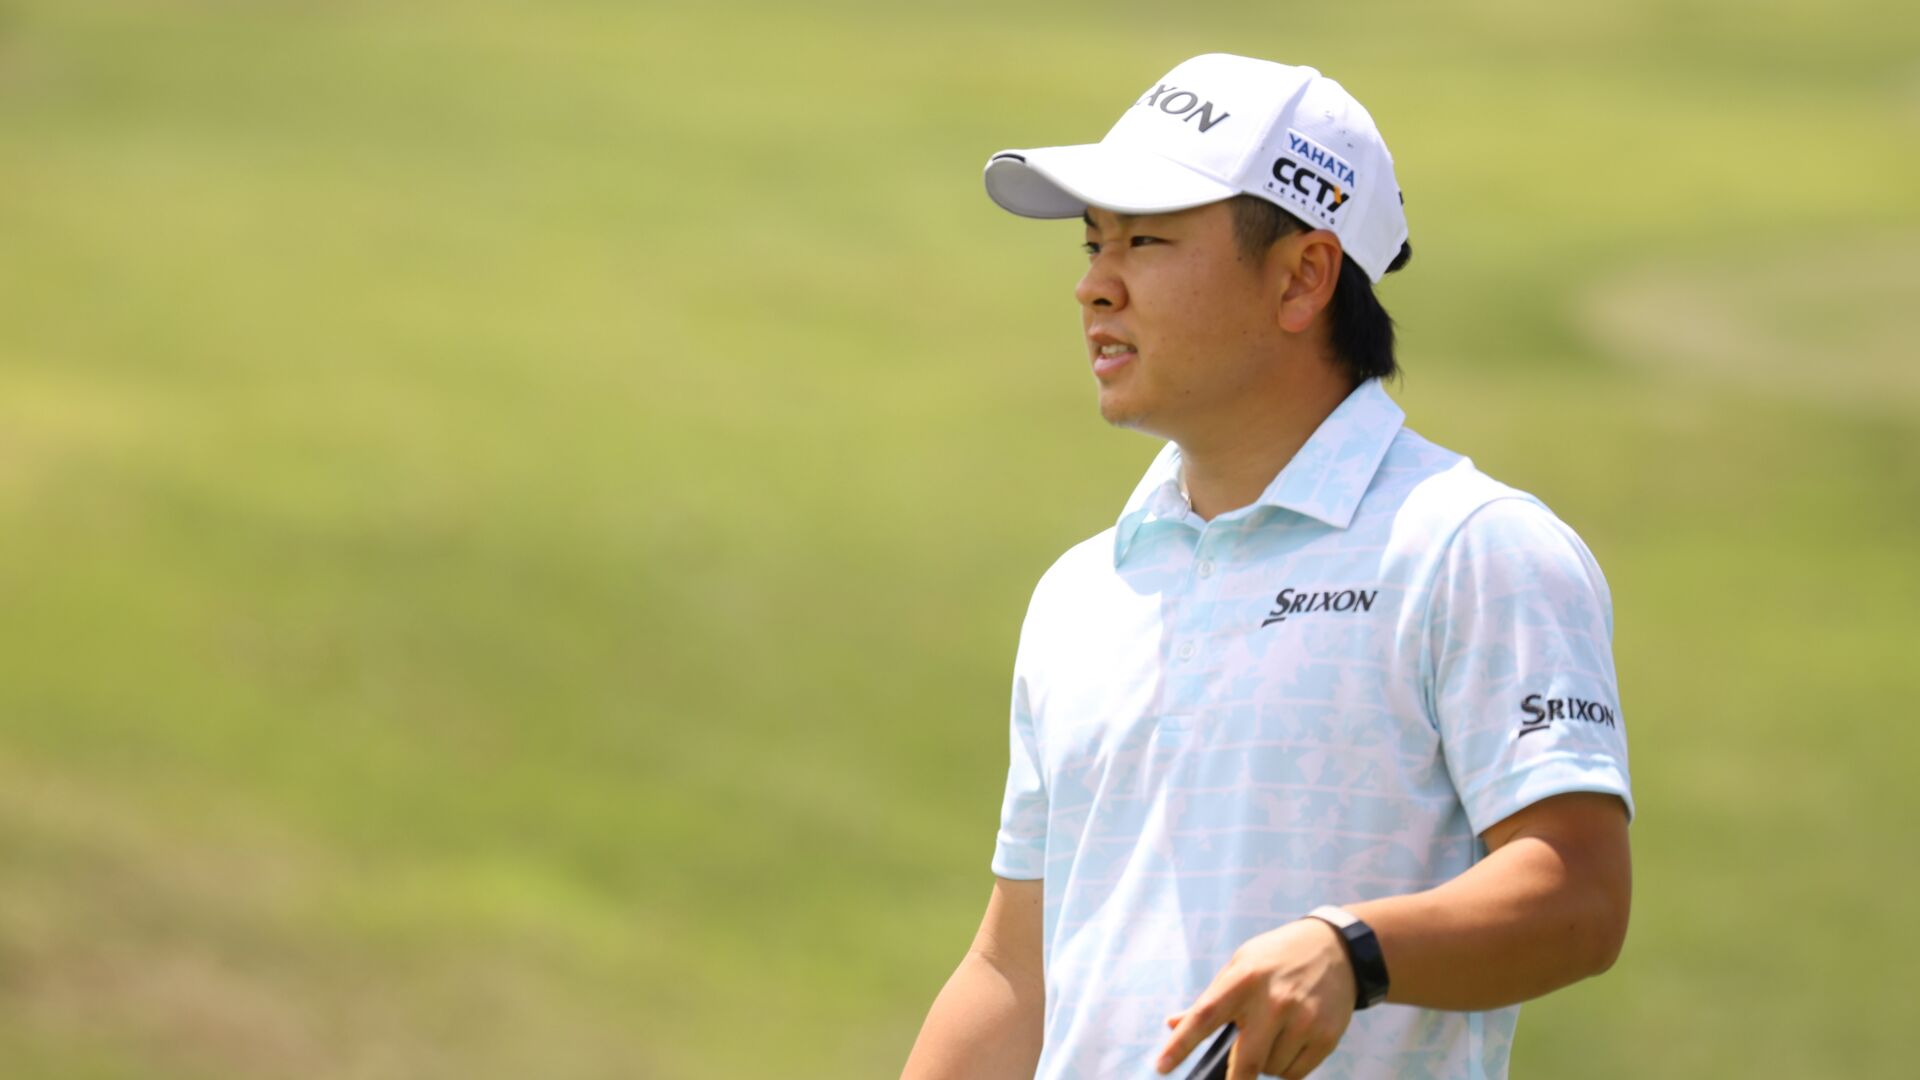
i Golf Shaper Challenge in 筑紫ヶ丘 2024
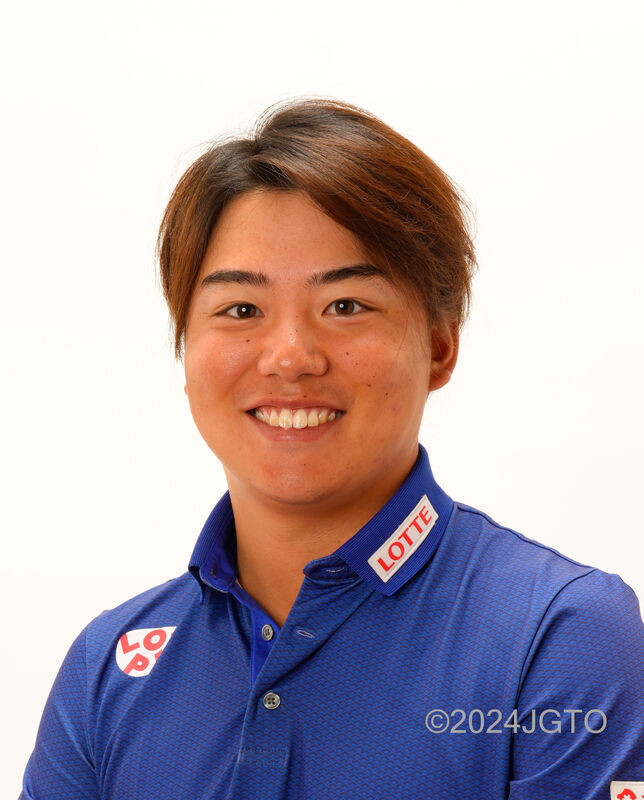
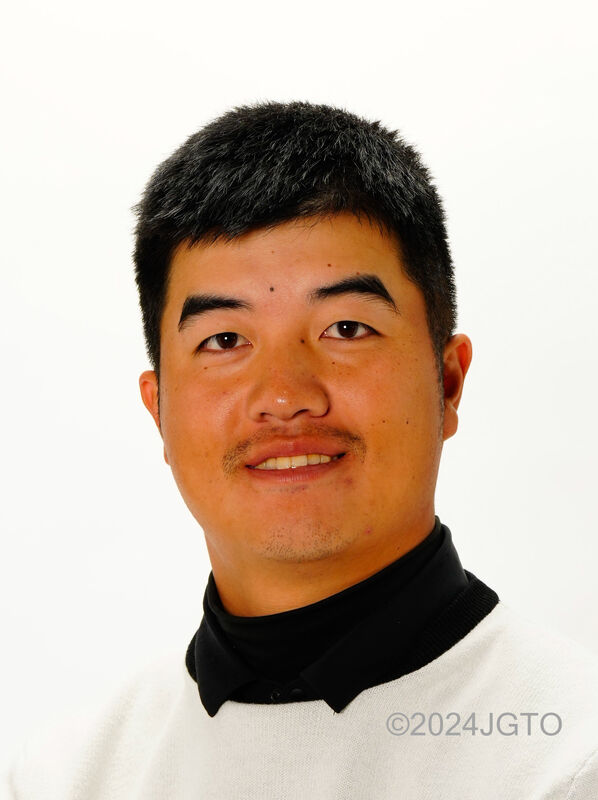
初優勝に必要なピースを探すための残り2日間に!久保田皓也が2位タイ発進
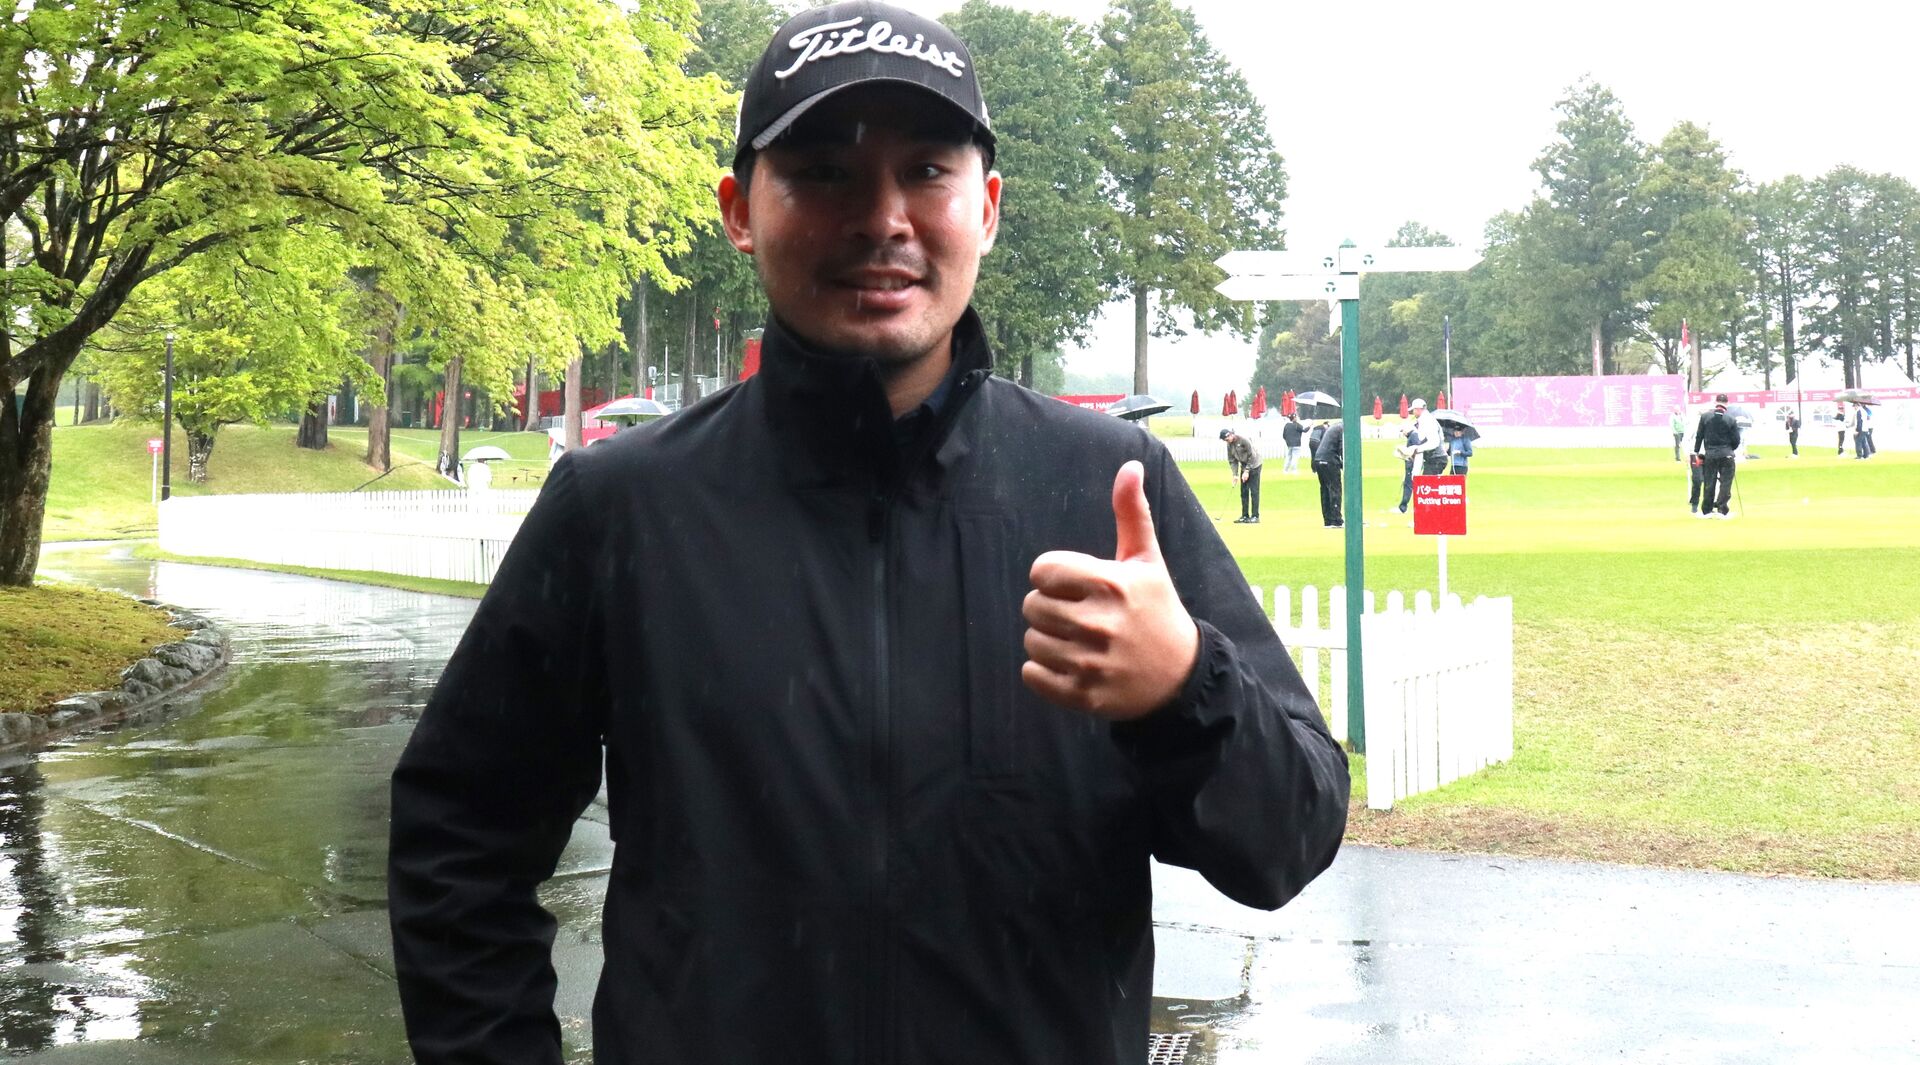
i Golf Shaper Challenge in 筑紫ヶ丘 2024
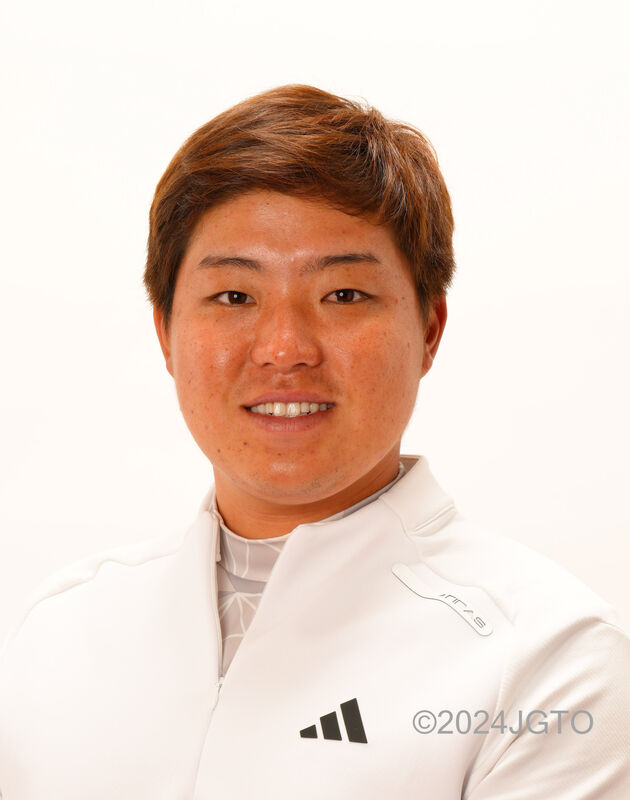
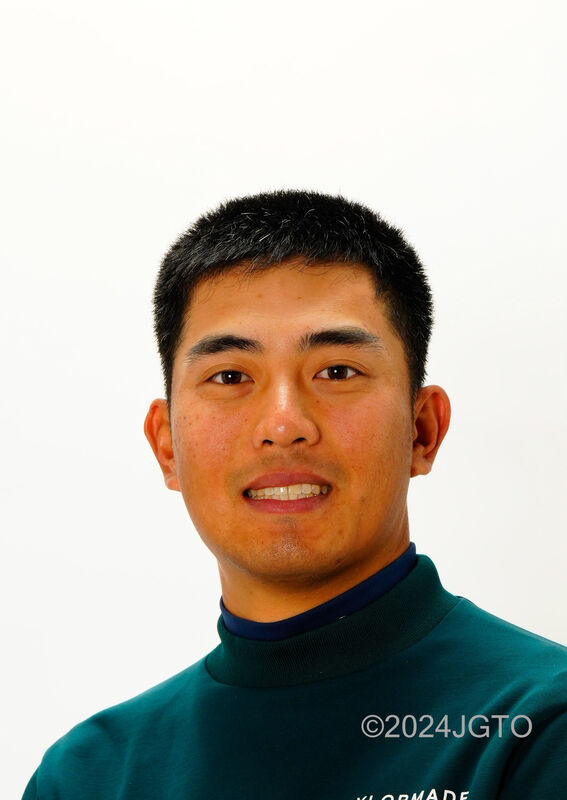
「優勝は口に出しません!」自分の強みに気づいた呉司聡が描く勝利の方程式
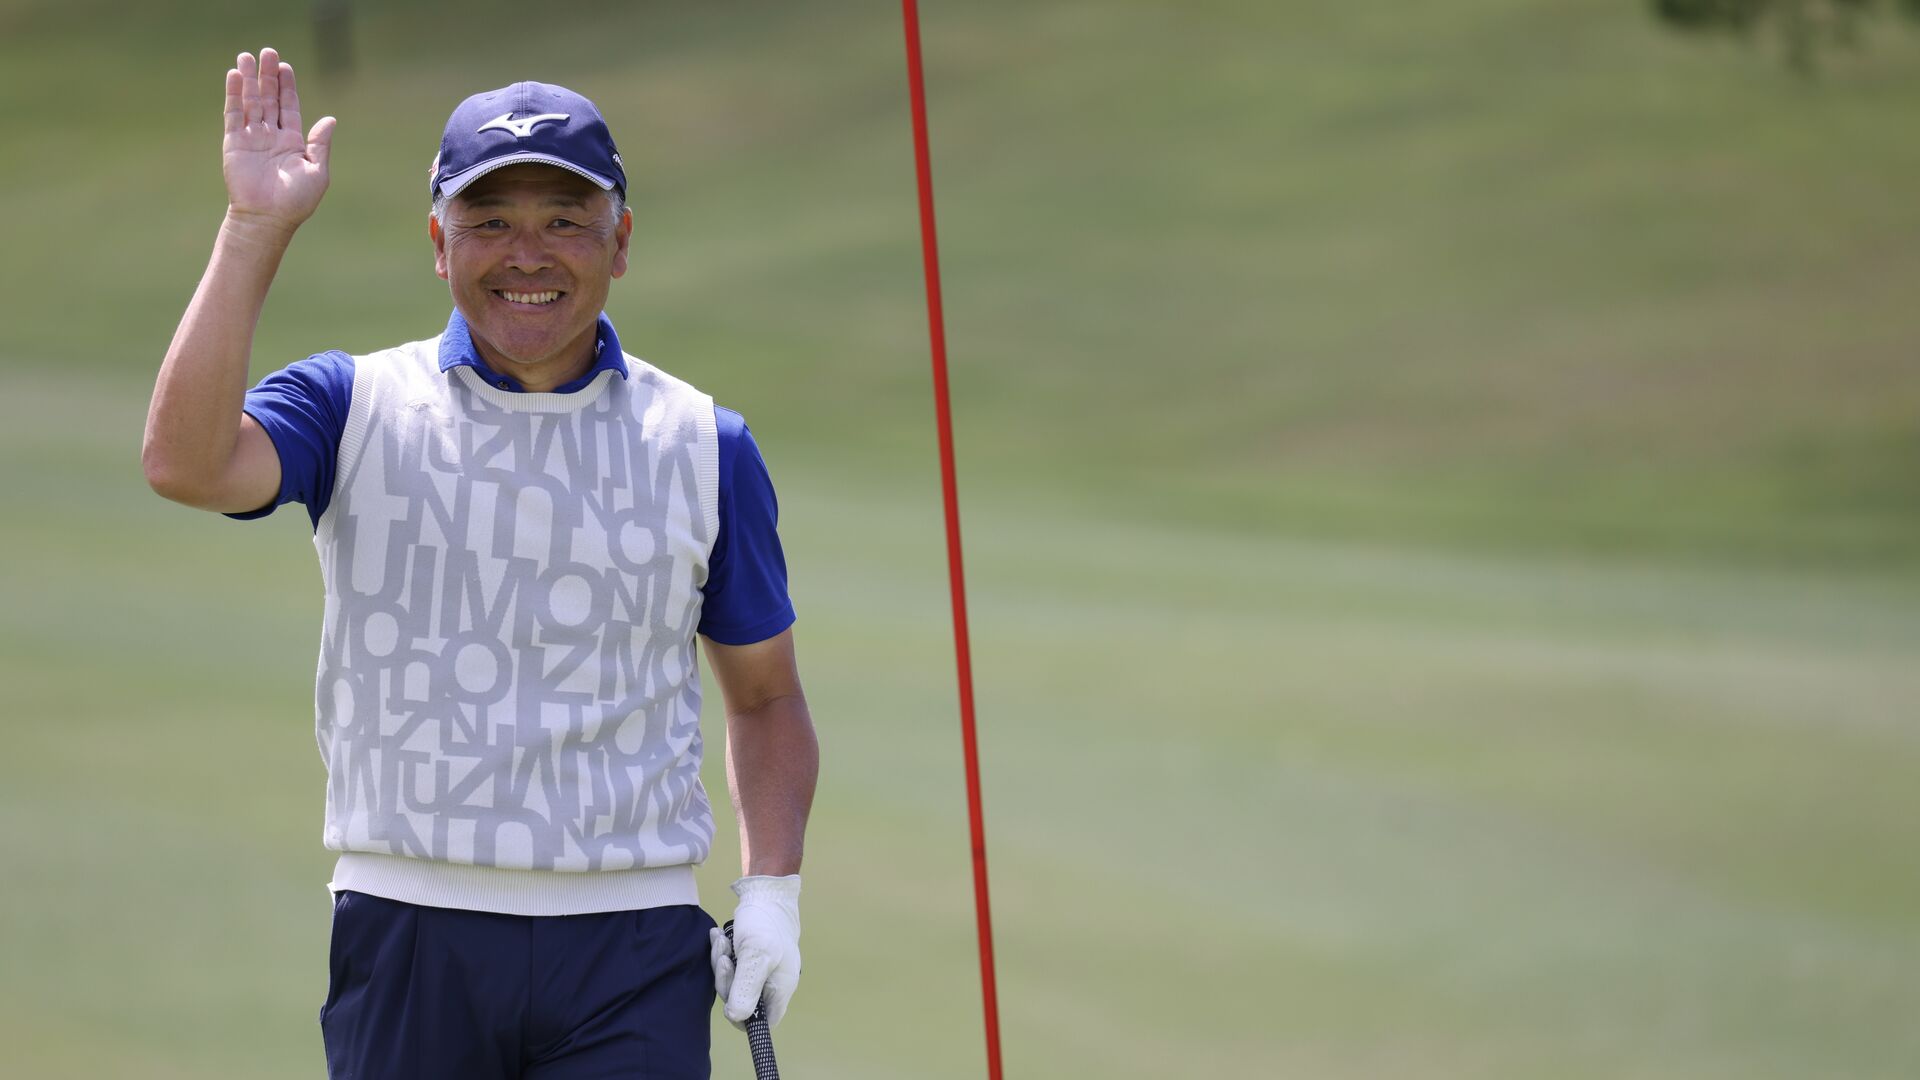
i Golf Shaper Challenge in 筑紫ヶ丘 2024
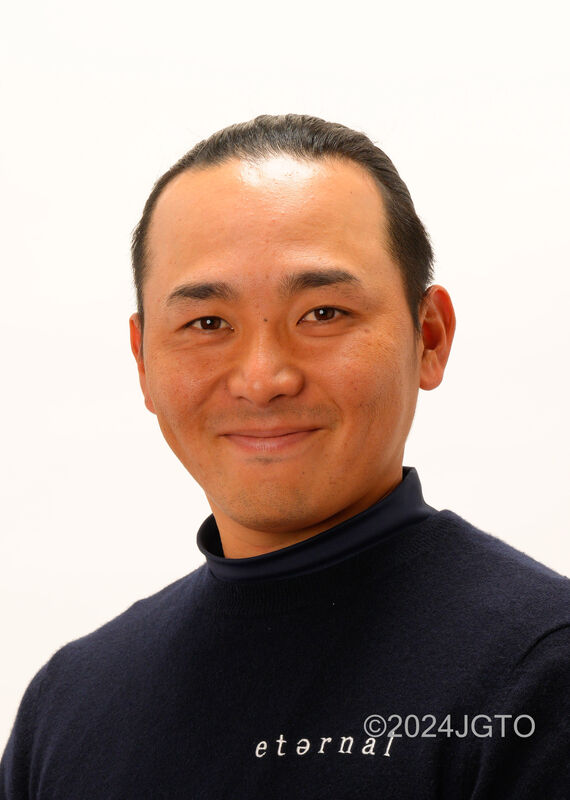
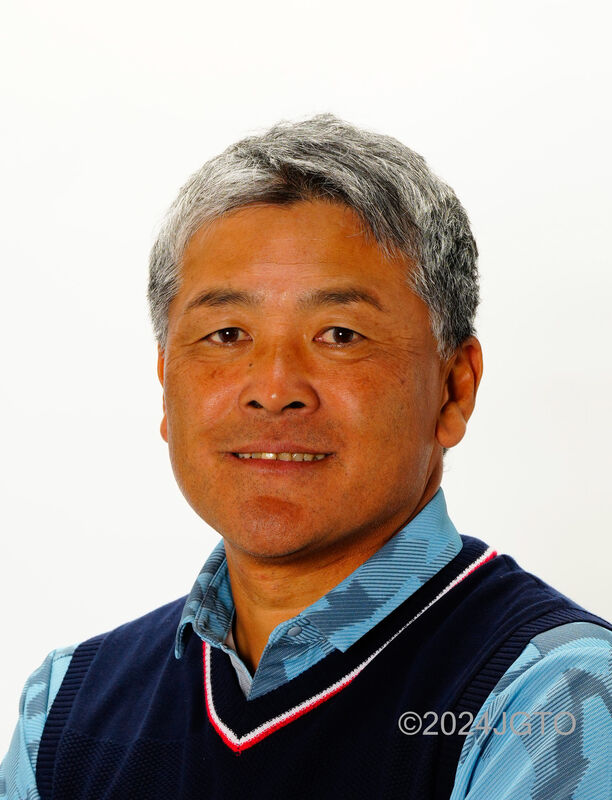
単独首位に手嶋多一!「明日は予選通過目指します(笑)」
ISPS HANDA 欧州・日本どっちが勝つかトーナメント! 2024
欧州で6季連続のシード権。川村昌弘が年いちの日本ツアーで願っていること
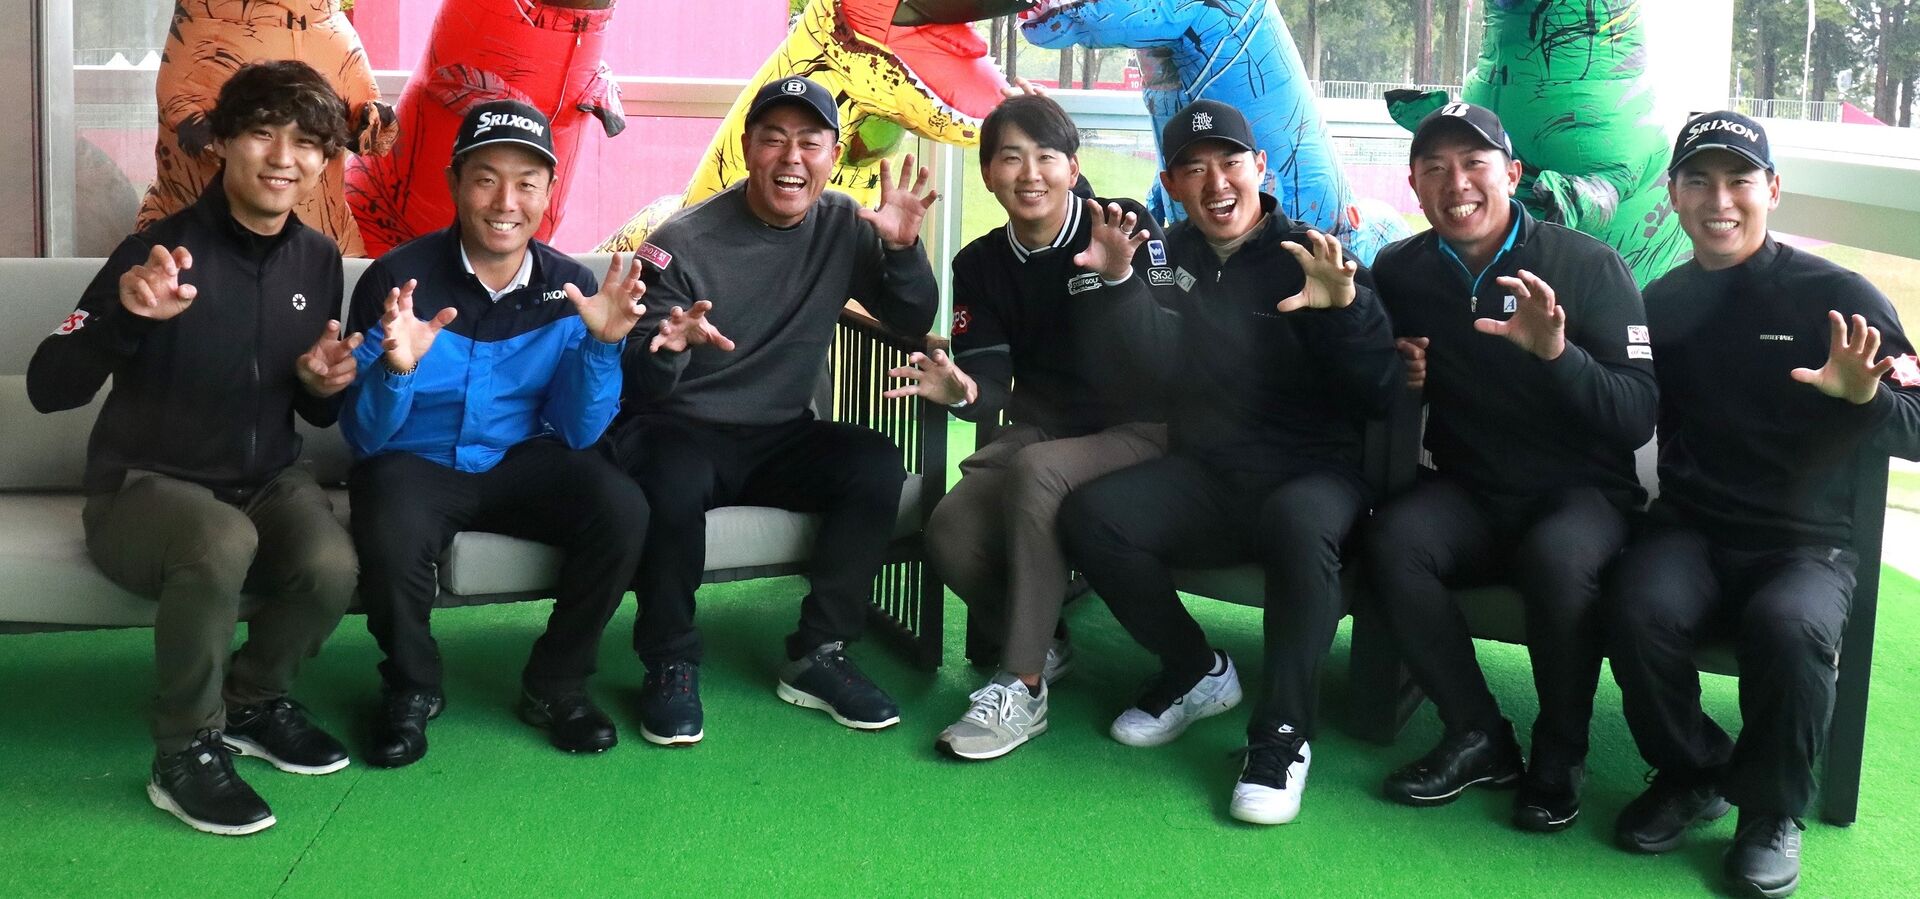
ISPS HANDA 欧州・日本どっちが勝つかトーナメント! 2024
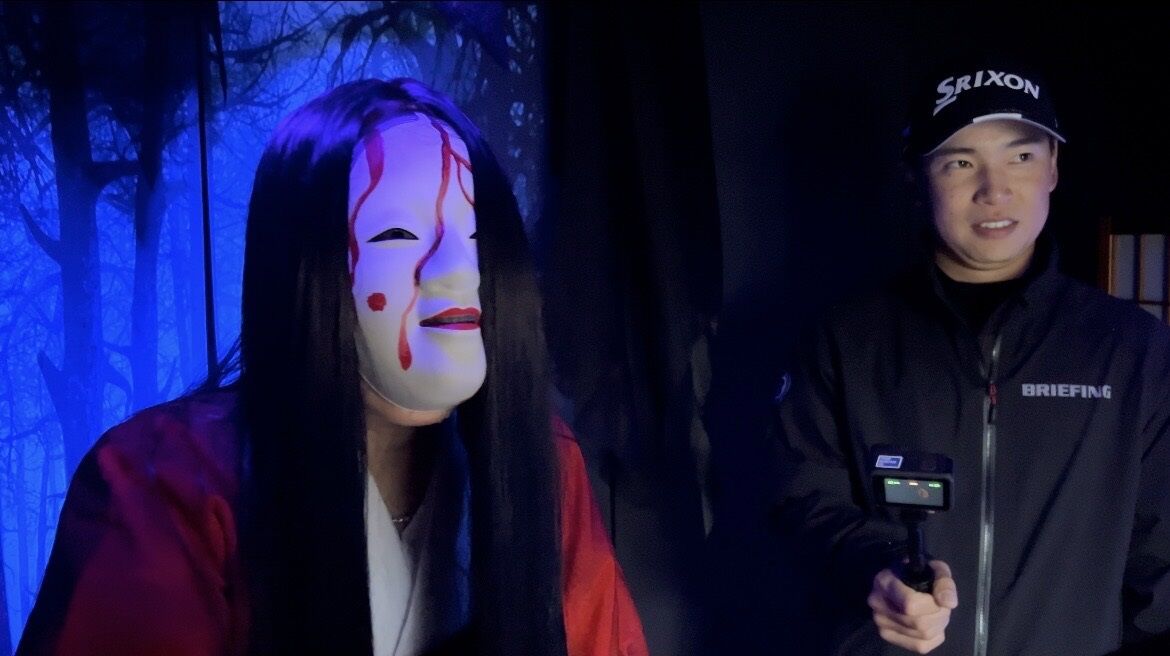
ホストプロらが「ガオ~」と意気込み! 鍋谷太一「楽しめるかは腕次第」
ISPS HANDA 欧州・日本どっちが勝つかトーナメント! 2024
中島啓太が凱旋「優勝争いを見ていただけたら」ホームの重圧を力に
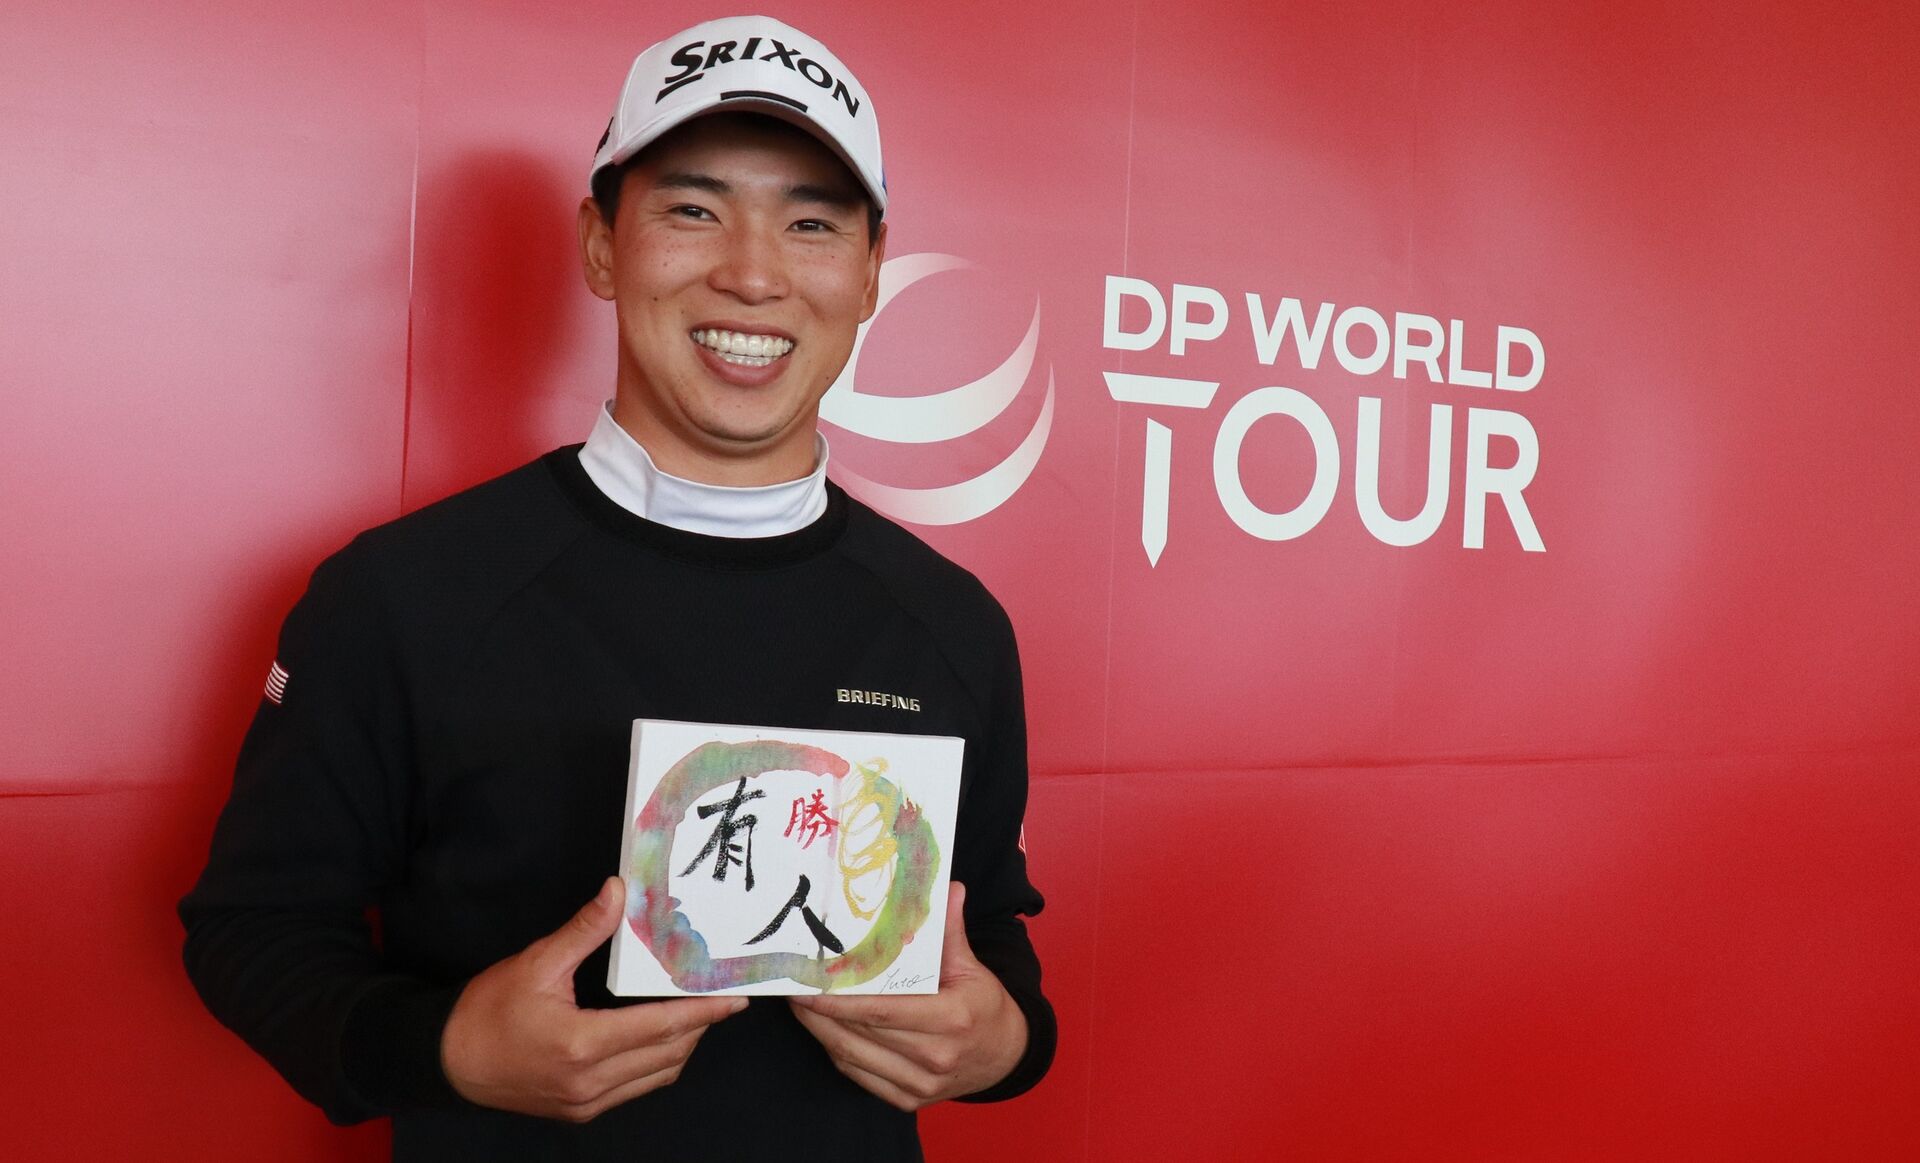
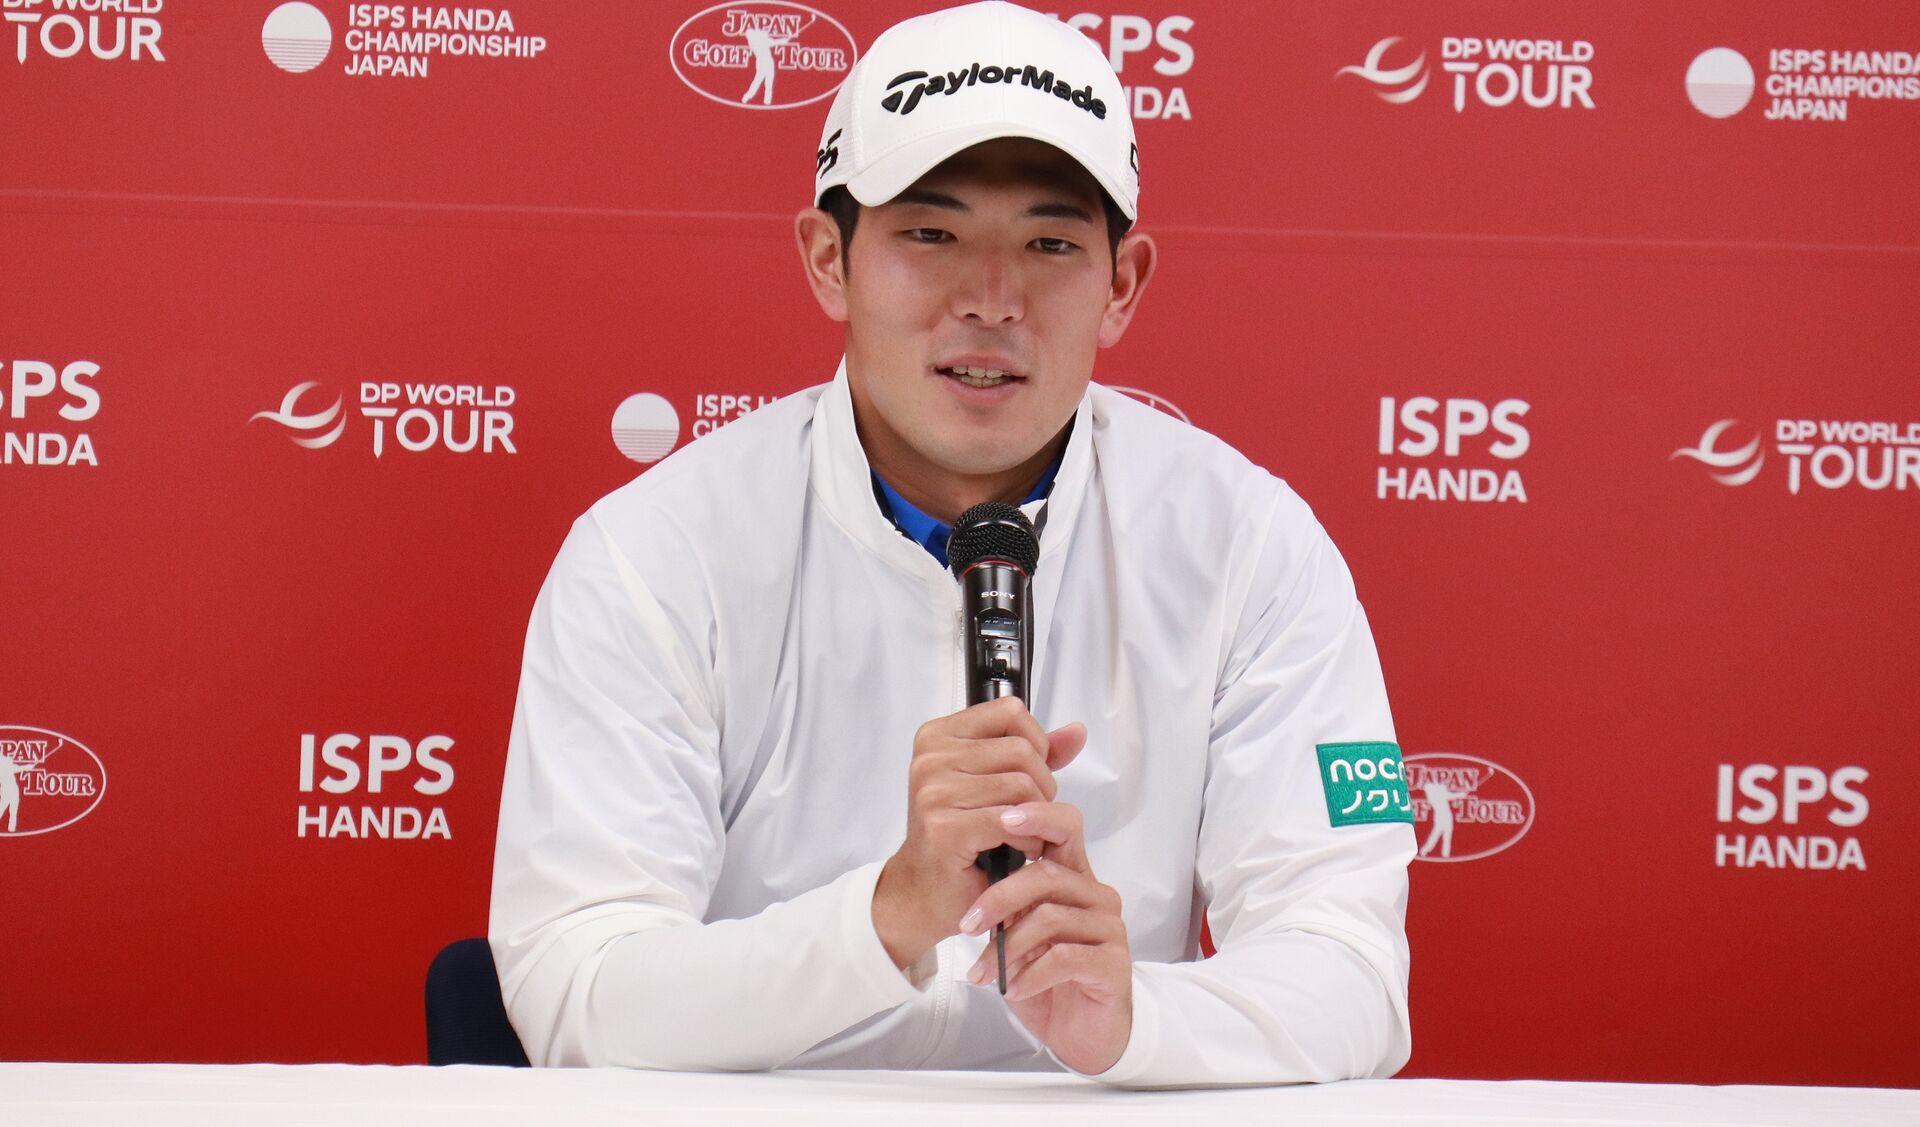
ISPS HANDA 欧州・日本どっちが勝つかトーナメント! 2024
欧州選手と書道で対決。桂川有人が「勝」

JAPAN PLAYERS CHAMPIONSHIP by サトウ食品 2024
6月「ジャパンプレーヤーズチャンピオンシップ by サトウ食品」の前売りチケットの販売を開始しました
Next Tour
| ツアー | 中日クラウンズ 2024 |
|---|---|
| 開催期間 | 2024年05月02日 ~05月05日 |
| 開催コース | 名古屋ゴルフ倶楽部 和合コース (愛知県) |
YouTube Channel
ALL「Discover Your Green」~中島啓太編
プロとして活動していく中で、「今後子供たちがゴルフに触れやすいような環境を作っていきたい」「アスリートを目指すジュニアの目標となれるような選手になっていきたい」
「Discover Your Green」~蟬川泰果編
プロデビューから1年が経った今シーズン #蝉川泰果 プロの想いは、「エンターテイナーとして感動を与えられるようなプレーをしたり、色々なところに目を向けられるように意識をして、被災地への寄付などの社会貢献をしていきたいです」
「Discover Your Green」 ~川村昌弘編
「自分が所属している企業は新薬開発を行っています。その中の取り組みで "希少疾患"について知ってもらうキャンペーン"RDD"が世界的に行われています。この活動に微力ながら参加し、ワッペンを付けて世界中を転戦しています。注目される場所であるゴルフで活躍することによって啓蒙活動をしていきたいです」
Information
- DP WORLD Tourスコア速報開始のお知らせ
- 日本国内プロゴルフトーナメントにおける新型コロナウイルス感染症対策に関するガイドライン廃止及び、その後の感染対策の考え方について
- トーナメントに出場する選手の肖像権について
Mercedes-Benz
Total Point Ranking
ALL生源寺 龍憲
Tatsunori SHOGENJI
エー・エム・エス
Rank1Point156pt
- Rank2181pt
- Rank3209pt
- Rank4222pt
- Rank5233pt
MoneyRanking
– Incl. international majors –
ALL金谷 拓実
Takumi KANAYA
Yogibo
Rank1Money¥26,000,000
- Rank2¥13,000,000
- Rank3¥8,840,000
- Rank4T¥5,720,000
- Rank4T¥5,720,000
MoneyRanking
– ABEMA tour only –
ALL小鯛 竜也
Tatsuya KODAI
フリー
Rank1Money¥2,700,000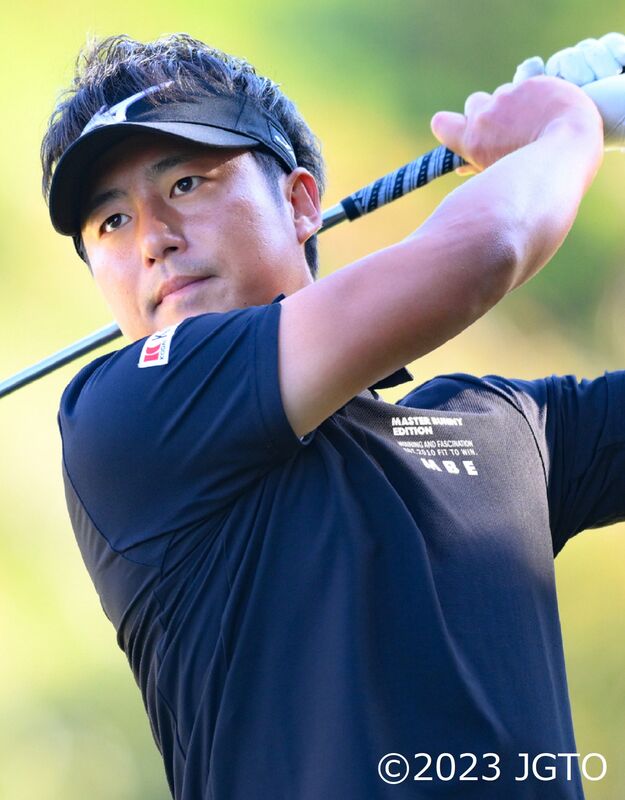
- Rank2T¥935,625
- Rank2T¥935,625
- Rank2T¥935,625
- Rank2T¥935,625
大会の舞台裏や最新情報を各ソーシャルメディアでも配信中です!